
Phoenix LiveView truly is a game changer for dynamic web app development. With the right guides and a little practice, we can very quickly get a web application stood up that gets snappy, dynamic updates from the server without page refresh and without much, if any, Javascript. But what happens when we get a decent amount of traffic and our LiveViews are not so snappy any more? Or what if we have some ambitious concurrency and latency requirements?
In this case, we need to measure our application's performance so we can eliminate issues that are holding us back from attaining our performance goals. Over the course of our future series on Phoenix LiveView, we intend to elaborate on this answer.
In this post, we will explore our goals for performance monitoring, and how we can use some of the native tools and libraries in the Phoenix and BEAM ecosystems. Specifically, we will discuss using Phoenix Live Dashboard (and in particular how to integrate BEAM telemetry) and Observer (and observer_cli). Phoenix Live Dashboard does require some setup, but this is very well documented on Hexdocs, as is how to add telemetry. The Observer tools are built into the BEAM and need no setup to start using straight away. Together, these two sets of tools can give us some quick wins in performance monitoring and potential issue identification.
It's important to note that in this post, we will concentrate on monitoring the performance of a running system. We won't cover the related topics of benchmarking or profiling. We will briefly discuss third-party tools for Application Performance Management (APM), but only to contrast with Live Dashboard and Observer. In future posts, we will explore how we can use third-party tools with our applications.
But for now, let's begin, by first enumerating the performance we want to measure!
LiveView performance monitoring goals
There are numerous ways we can measure or observe the performance of an Elixir application. In this post we will focus on a small set that have been found to be useful when we are developing a LV app with high concurrency and responsiveness goals.
LV lifecycle latency: mounting, patching, event & message handling, and rendering of specific LiveViews to look for issues identified in end-to-end responsiveness
CPU load: of the BEAM, and of specific processes
Memory consumption: of the BEAM, and of specific processes (e.g. to look for memory leaks or too much of the UI or application state held in single processes)
BEAM process message queues: to find concurrency bottlenecks (e.g. singleton GenServers), overwhelming message rate (PubSub, Process.send etc), or slow database queries or external service calls
With these goals in mind, let's investigate some tools we have close at hand to observe performance. First cabs off the rank are the new(-ish) shiny from the BEAM and Phoenix - BEAM Telemetry and Phoenix Live Dashboard.
BEAM Telemetry & Phoenix Live Dashboard
A more recent initiative in the BEAM community is Telemetry, a common interface for producing telemetry events and reporting telemetry metrics in BEAM applications. Telemetry events are numerical measurements with metadata, where the measurements could be pretty much anything we can imagine we could instrument in our code, such as request times & durations, numbers & sizes of resources, or event low-level BEAM information. Metrics are timeseries derived from the telemetry events, which can be reported to some other (sub)system of storage and/or visualisation.
Another recent development is Phoenix Live Dashboard, which is an observability library that you can drop into a phoenix application to provide a LV-based dashboard to show system state and telemetry metrics. Saying that Live Dashboard is a "tool we have close at hand" is a bit disingenuous as it does require some setup. However, this process is well documented, and by following guides (including the one below!) we can quickly get a dashboard and some metrics going in our own app, without the complication of some third-party observability service.
Buckle-up, let's get Live Dashboard and some telemetry going!
Setup
As of writing this post, the latest Phoenix generator mix task (mix phx.new) will, by default, set up Live Dashboard with some default telemetry (but no storage of metrics history). If we want to generate a new app with the mix task, we can skip most of the preliminary setup and skip to adding metrics history. Otherwise, we can replicate what the mix task produces ourselves!
Pre-requisites
We assume that we've already installed LiveView and want to setup Live Dashboard manually. The following link can be seen for more:
https://hexdocs.pm/phoenixlivedashboard/Phoenix.LiveDashboard.html#module-installation
Install Phoenix Live Dashboard
Firstly, we need to add Live Dashboard as a dependency to our app.
# mix.exs
defp deps() do
  [
    ...
    {:phoenix_live_dashboard, "~> 0.4"},
    ...
  ]
end
Next, in our Phoenix router, we add the dashboard route. The guides discuss various ways we could (and should) increase the security of the dashboard in a real app, but for now, we will simply enable the dashboard in dev only.
# lib/my_app_web/router.ex
...
if Mix.env() == :dev do
  scope "/" do
    pipe_through :browser
    live_dashboard "/dashboard"
  end
...
end
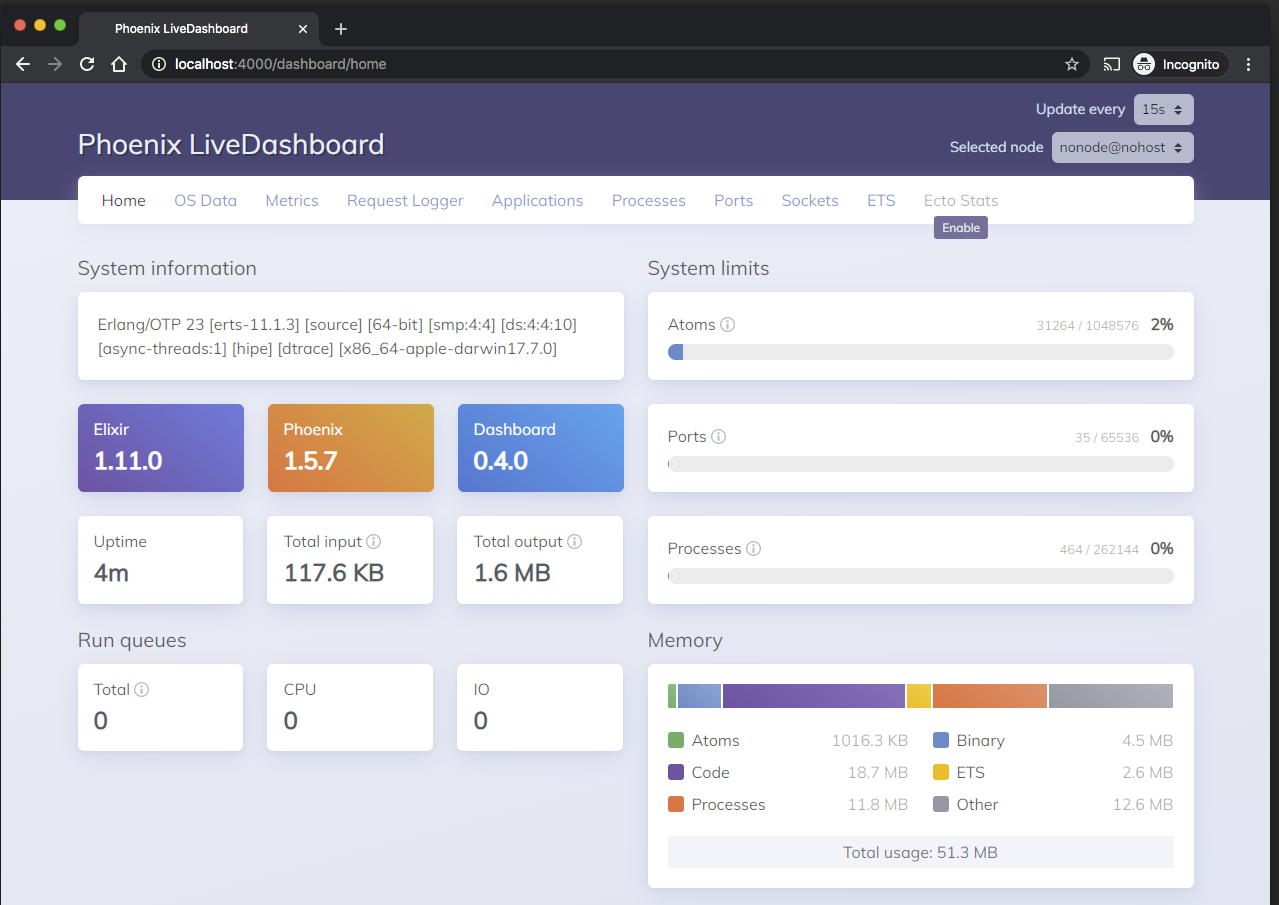
Navigating to /dashboard in our dev environment will bring up Live Dashboard and we should see something like this:
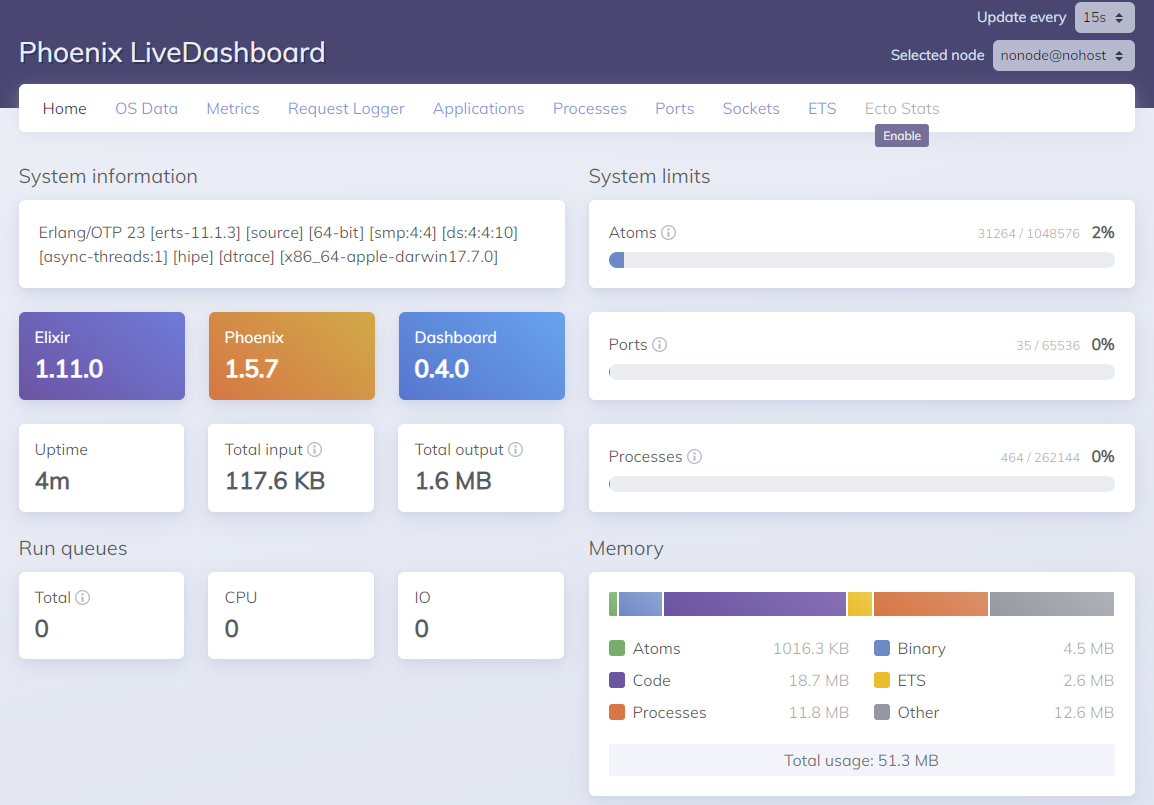
We can see that the Metrics menu item is disabled with an option to enable it. If we click on the link, we're taken to the guide docs for installing and configuring metrics in Live Dashboard: https://hexdocs.pm/phoenixlivedashboard/metrics.html
We'll do that now.
Set up metrics
We need to make sure that the following deps are added to our mix.exs (they may already be there depending on whether we generated our Phoenix app after v1.5).
# mix.exs
defp deps() do
  [
    ...
    {:telemetry_poller, "~> 0.5"},
    {:telemetry_metrics, "~> 0.6"},
    ...
  ]
end
The Live Dashboard metrics guide provides a template Telemetry module, so we'll add that to our application verbatim.
# lib/my_app_web/telemetry.ex
defmodule MyAppWeb.Telemetry do
  use Supervisor
  import Telemetry.Metrics

  def start_link(arg) do
    Supervisor.start_link(__MODULE__, arg, name: __MODULE__)
  end

  @impl true
  def init(_arg) do
    children = [
      # Telemetry poller will execute the given period measurements
      # every 10_000ms. Learn more here: https://hexdocs.pm/telemetry_metrics
      {:telemetry_poller, measurements: periodic_measurements(), period: 10_000}
      # Add reporters as children of your supervision tree.
      # {Telemetry.Metrics.ConsoleReporter, metrics: metrics()}
    ]

    Supervisor.init(children, strategy: :one_for_one)
  end

  def metrics do
    [
      # Phoenix Metrics
      summary("phoenix.endpoint.stop.duration",
        unit: {:native, :millisecond}
      ),
      summary("phoenix.router_dispatch.stop.duration",
        tags: [:route],
        unit: {:native, :millisecond}
      ),

      # Database Time Metrics
      summary("my_app.repo.query.total_time", unit: {:native, :millisecond}),
      summary("my_app.repo.query.decode_time", unit: {:native, :millisecond}),
      summary("my_app.repo.query.query_time", unit: {:native, :millisecond}),
      summary("my_app.repo.query.queue_time", unit: {:native, :millisecond}),
      summary("my_app.repo.query.idle_time", unit: {:native, :millisecond}),

      # VM Metrics
      summary("vm.memory.total", unit: {:byte, :kilobyte}),
      summary("vm.total_run_queue_lengths.total"),
      summary("vm.total_run_queue_lengths.cpu"),
      summary("vm.total_run_queue_lengths.io")
    ]
  end

  defp periodic_measurements do
    []
  end
end
The sample code shows how we can add some metrics from our app's imported libraries (specifically Phoenix and Ecto) and the BEAM VM. It also hints at how to set up a telemetry poller and add reporters.
If we focus on one small fragment from the telemetry module, we can see how metrics can be reported.
# lib/my_app_web/telemetry.ex
...
summary("phoenix.router_dispatch.stop.duration",
  tags: [:route],
  unit: {:native, :millisecond}
),
...
In the code snippet above, we are specifying that we want a summary of the measurement duration for the telemetry event phoenix.router_dispatch.stop.
A summary will record some basic statistics (min, max, average) for the measurement as well as its raw value.
We specify that we want to record the :route metadata value as a tag.
This means that we get a timeseries for each distinct value of route, which is useful to disaggregate metric data about each of our routes.
The unit keyword is used for conversion of units of measure, in this case saying that we want to convert the native time value of the event into milliseconds.
We will return to this module later so we can see how to customise it with more metrics.
For now, to get our Telemetry module working for us, it has to be added to the application's supervision tree.
# lib/my_app/application.ex
...
children = [
  MyApp.Repo,
  MyAppWeb.Telemetry,
  MyAppWeb.Endpoint,
  ...
]
...
Finally, we will have to update our router to point Live Dashboard at our Telemetry module.
# lib/my_app_web/router.ex
...
live_dashboard "/dashboard", metrics: MyAppWeb.Telemetry
...
Restarting our application and hitting the dashboard again will result in us being able to click the Metrics menu item.
On the Metrics page we can see a bunch of sub-menu items, each of which brings up some live-updating time-series charts that relate back to the metrics defined in MyAppWeb.Telemetry.metrics.
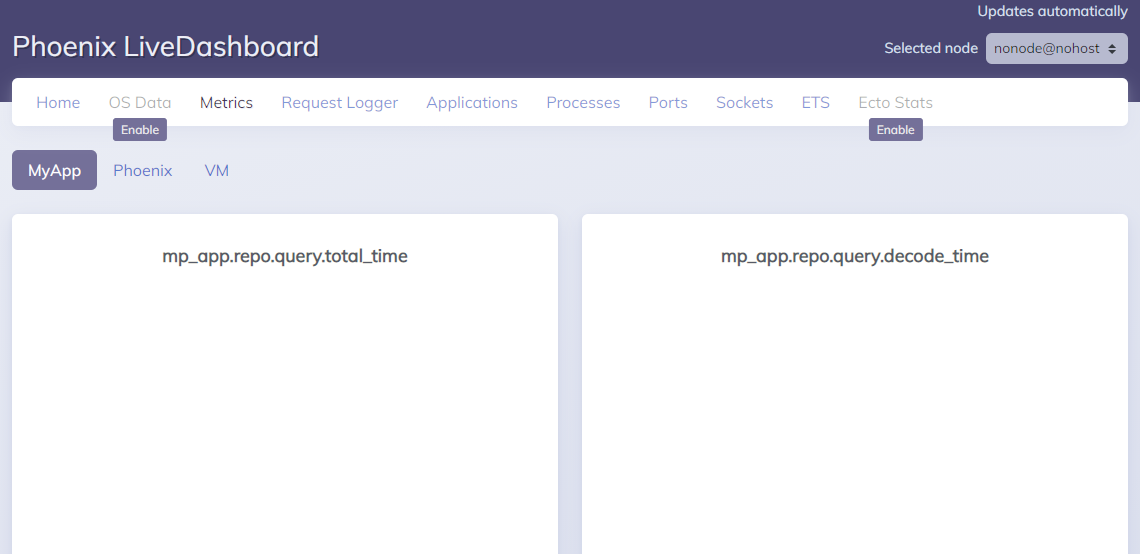
This is great, but the history of these metrics is not persisted anywhere. To do that, we must add a metrics history module, which we will do now.
Metrics history
The guide provides an example metrics history storage module, based upon the CircularBuffer package (https://hexdocs.pm/circular_buffer/CircularBuffer.html).
First, we'll add the circular buffer dep.
# mix.exs
defp deps() do
  [
    ...
    {:circular_buffer, "~> 0.3"},
    ...
  ]
end
Second, we update our live dashboard
# lib/my_app_web/router.ex
...
live_dashboard "/dashboard",
  metrics: MyAppWeb.Telemetry,
  metrics_history: {MyApp.MyStorage, :metrics_history, []}
...
Then, we'll implement our store.
# lib/my_app/my_storage.ex
defmodule MyApp.MyStorage do
  use GenServer

  @history_buffer_size 50

  def metrics_history(metric) do
    GenServer.call(__MODULE__, {:data, metric})
  end

  def start_link(args) do
    GenServer.start_link(__MODULE__, args, name: __MODULE__)
  end

  @impl true
  def init(metrics) do
    Process.flag(:trap_exit, true)

    metric_histories_map =
      metrics
      |> Enum.map(fn metric ->
        attach_handler(metric)
        {metric, CircularBuffer.new(@history_buffer_size)}
      end)
      |> Map.new()

    {:ok, metric_histories_map}
  end

  @impl true
  def terminate(_, metrics) do
    for metric <- metrics do
      :telemetry.detach({__MODULE__, metric, self()})
    end

    :ok
  end

  defp attach_handler(%{event_name: name_list} = metric) do
    :telemetry.attach(
      {__MODULE__, metric, self()},
      name_list,
      &__MODULE__.handle_event/4,
      metric
    )
  end

  def handle_event(_event_name, data, metadata, metric) do
    if data = Phoenix.LiveDashboard.extract_datapoint_for_metric(metric, data, metadata) do
      GenServer.cast(__MODULE__, {:telemetry_metric, data, metric})
    end
  end

  @impl true
  def handle_cast({:telemetry_metric, data, metric}, state) do
    {:noreply, update_in(state[metric], &CircularBuffer.insert(&1, data))}
  end

  @impl true
  def handle_call({:data, metric}, _from, state) do
    if history = state[metric] do
      {:reply, CircularBuffer.to_list(history), state}
    else
      {:reply, [], state}
    end
  end
end
All of this is taken from https://hexdocs.pm/phoenixlivedashboard/metrics_history.html so we can hit that up for more explanation of the code.
Finally, the store needs to be added into the application's supervision tree.
# lib/my_app_web/telemetry.ex
...
children = [
      # Telemetry poller will execute the given period measurements
      # every 10_000ms. Learn more here: https://hexdocs.pm/telemetry_metrics
      {:telemetry_poller, measurements: periodic_measurements(), period: 10_000}
      # Add reporters as children of your supervision tree.
      {MyApp.Telemetry.TelemetryStore, metrics()}
]
...
At this point, telemetry metrics are persisted in memory, with a limit of 50 entries per metric (which we could adjust if we wanted to keep more). We should remember that the metrics could have been persisted anywhere - like our database, ETS, DETS, or some other appropriate timeseries store. But with one library import and a small amount of code, we have a store that we can use while our app is running.
With the store in place, we can look at metrics to help start identifying performance issues. There are, however, a few extra metrics that we can add into our telemetry module that the guide does not cover, and we will do that now.
LV telemetry metrics
To get more insight into the lifecycle latencies of LV, we can add some telemetry metrics that are specific to LV into our Telemetry.metrics/0 function. The telemetry for LV also includes event start times, as well as telemetry for exceptions as opposed to successful invocations as we are adding below. Conveniently, the metadata for the telemetry events includes the LV socket, and in the case of handle_event, the event name, among other things. We can use this to produce a tag for the metric values that will allow us to distinguish different views and events.
# lib/my_app_web/telemetry.ex
...
summary("phoenix.live_view.mount.stop.duration",
  tags: [:view],
  tag_values: fn metadata ->
    Map.put(metadata, :view, "#{inspect(metadata.socket.view)}")
  end,
  unit: {:native, :millisecond}
),
summary("phoenix.live_view.handle_params.stop.duration",
  tags: [:view],
  tag_values: fn metadata ->
    Map.put(metadata, :view, "#{inspect(metadata.socket.view)}")
  end,
  unit: {:native, :millisecond}
),
summary("phoenix.live_view.handle_event.stop.duration",
  tags: [:view, :event],
  tag_values: fn metadata ->
    Map.put(metadata, :view, "#{inspect(metadata.socket.view)}")
  end,
  unit: {:native, :millisecond}
),
...
We now have some useful metrics in place to allow us to look for particular problems in our LiveViews.
Result
With our telemetry system implemented and hooked into Live Dashboard, we can get an impression of the performance of our LiveViews. Dashboard, out-of-the-box, gives us the ability to see the state of the running system and look for potential causes of issues as we become aware of them. Furthermore, with telemetry and telemetry history, we can look at the recent performance of the application, and with some customisation, get an idea of the performance of our individual views.
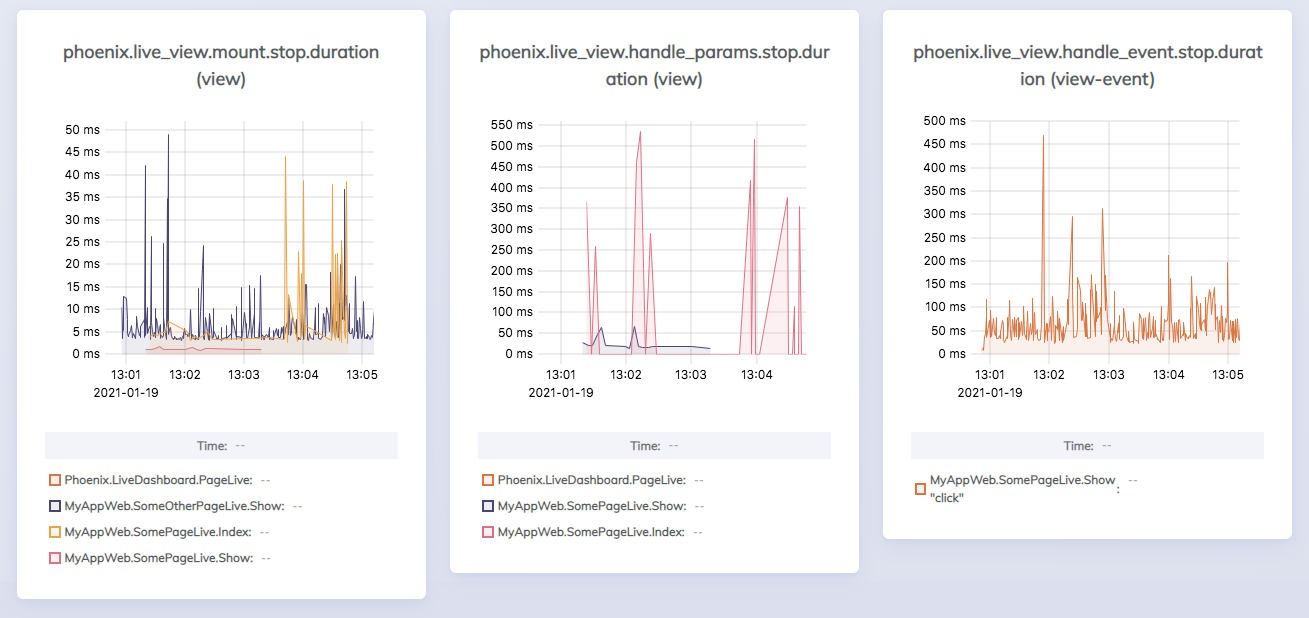
Latency
Adding the LV-specific telemetry with appropriate tags allows us to look at the latency of our views. The below charts will be added to the Phoenix metrics view in the dashboard. If we inject a randomly occurring fault into the handle_params of one of our LiveViews, we can see how the charts (specifically the red pen in the middle one below) can reveal latency issues in particular views. We could then perhaps track this down, with the help of other metrics such as those for Ecto, to a root cause.
Message queues
In a real-time web app having aspirations for high connection counts and low latency during peak loads, concurrency is of prime importance. We don't want an event that causes all aboard to change sides of the ship to lead to it capsizing. Something to watch for, then, is concurrency bottlenecks in our app. A sure sign that one has crept in is one or more BEAM process message queues filling up over periods of high sustained load.
If we inject a fault into one of our LiveViews where it sends itself two messages every time it receives one message, we can simulate a concurrency bottleneck. In the processes view in Live Dashboard, we can sort the process list by message queue length (MsgQ) and see if any processes have a build-up of messages.
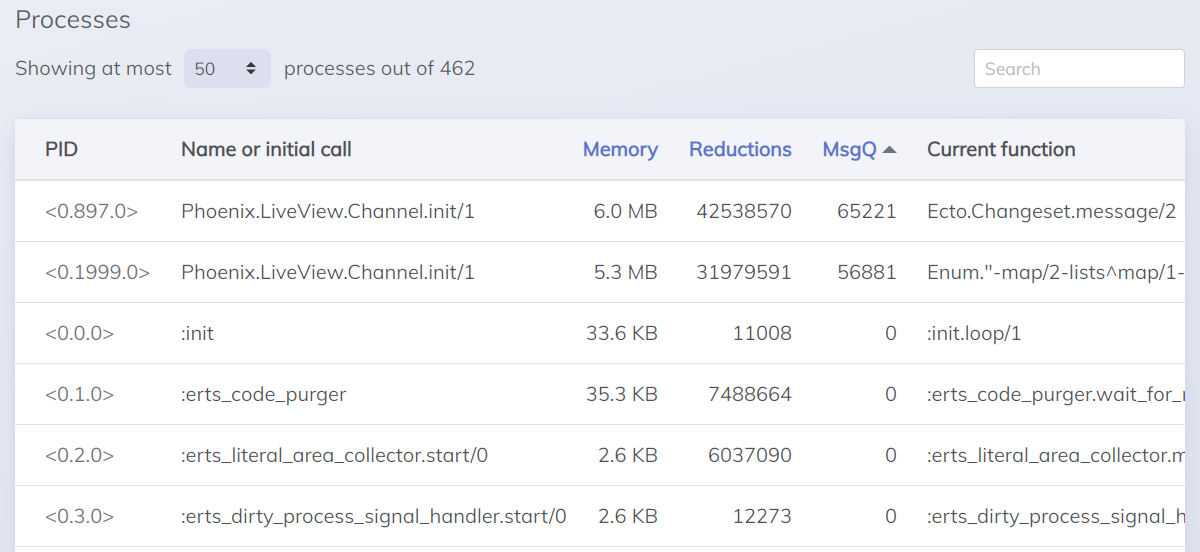
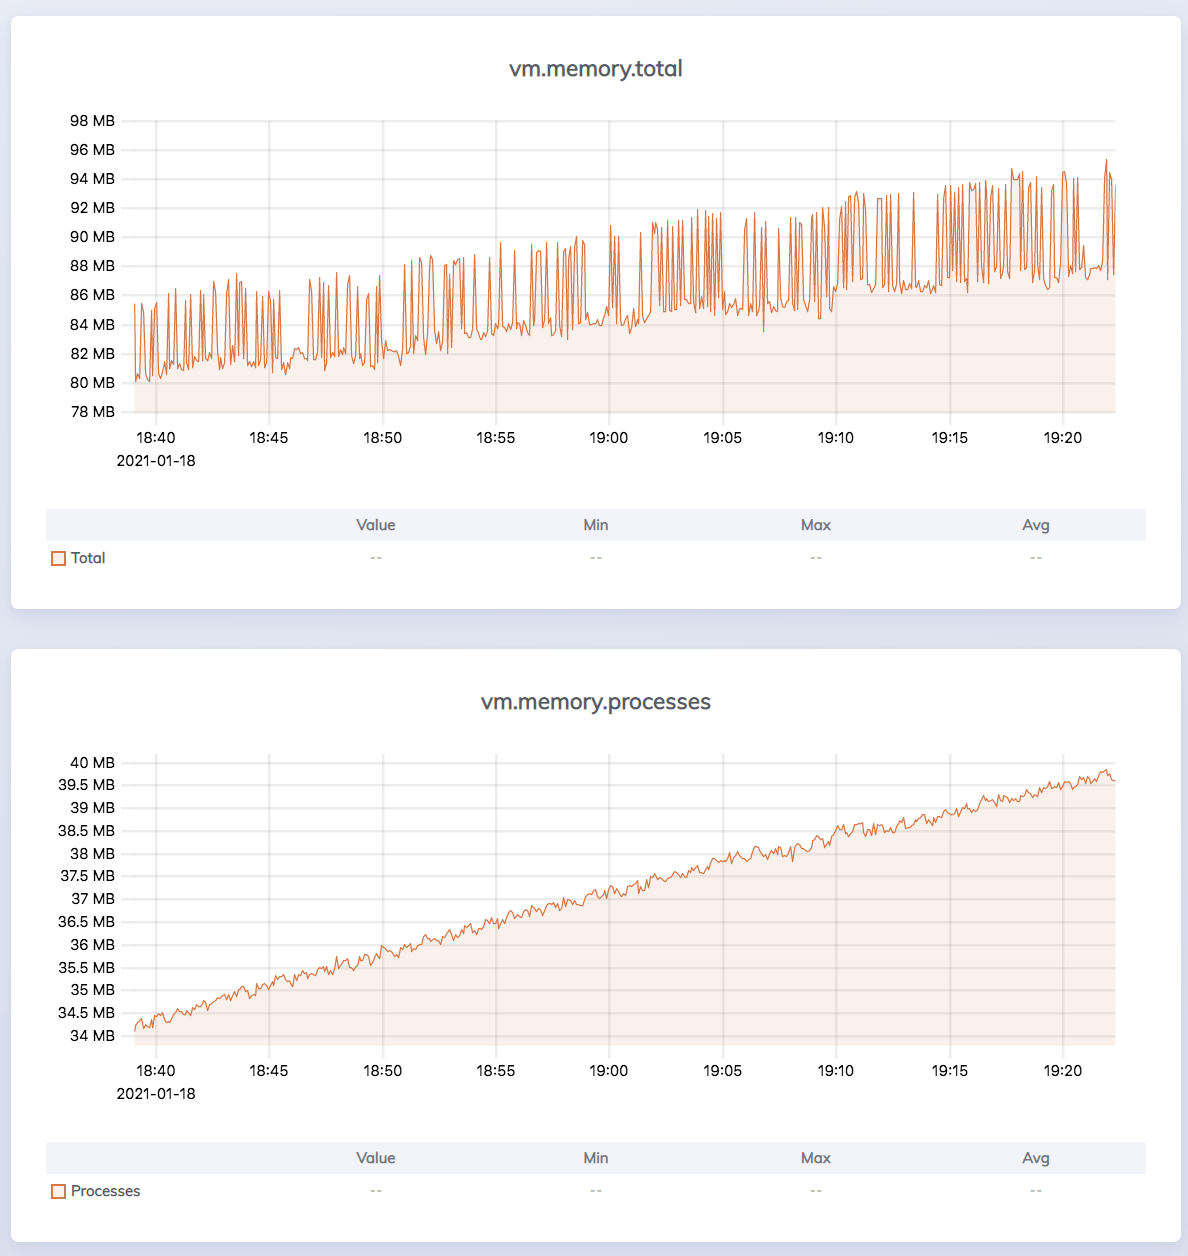
The processes with the backed-up message queues also have high memory usage, and indeed, when we look at the VM metrics view in the dashboard, we can see that process memory allocation in the BEAM is ramping up. Not something we'd want to see in a live system.
Application Performance Monitoring tools
With not a huge amount of effort, we have implemented some basic observability for our application's performance. As the guide suggests, we could implement metric history in an external metrics storage service. This would have the advantage that we would be separating the metrics from the main app, at the cost of making the deployment potentially more complicated (and expensive). But with Live Dashboard, we still have the user interface of our observability integrated with our application. Again, there is a tradeoff here. Do we want the system to be monitored separate from the monitoring system, to reduce interference (don't cross the beams).
An alternative to Live Dashboard and telemetry history, is to implement a reporter out to a third party metrics system to perform Application Performance Monitoring (APM). This could be an off-the-shelf APM tool or a customised system consisting of an external timeseries database with a dashboarding tool like Grafana on top. Some of the facilities in dashboard that we haven't covered are more qualitative and don't easily translate into the timeseries world of APM, so in that way, there is a differentiation in feature. However, for what we've discussed, there is a fair amount of overlap of the basic concept. APM tools and the likes of Grafana are much more mature products than Live Dashboard. The timeseries charts in Live Dashboard are nice looking but lack functionality and customisability that you get in a mature product. Add to that all the other features provided by external tools, and the distinction grows.
So we can see that it really is a trade off between getting something up and running quickly verses the investment in a mature tool. We've shown that it's not impossible to identify performance issues using Live Dashboard, so we must apply engineering and value judgment as to when and whether we use it or go with a more mature tool.
Wrapping up Live Dashboard
We've seen how we can set up Live Dashboard to store some of our application's metrics. With a small amount of tweaking, we can add a few more metrics that are useful specifically for LiveView. With that done, we've been able to identify some performance issues in our LiveViews. Live Dashboard allowed us to get up and running quickly, but we mustn't forget the ecosystem of APM that we live in.
Now we will move on and look at some other veteran tools in the BEAM ecosystem that can also assist us in monitoring the performance of our LiveView apps. We are, of course, referring to Observer and observer\_cli!
Observer and observer_cli
Observer is a fantastic tool built into the BEAM for, ah, observing BEAM applications. It is started from a shell (optionally connected to a remote node) with iex(1)> observer.start (in Elixir), after which it opens as a full GUI application. We don't have to import any dependency to get observer going,
observer_cli is an equivalent tool that runs inside the shell, which can be more convenient in scenarios such as when we are SSHing into a server or exec'ing into a container. We do need to add it as a dependency to our application with {:observer_cli, "~> 1.6"}. We can then fire up the CLI version with iex(1)> observer_cli.start. We are presented with, as expected, a text UI right in the shell. To avoid annoying log messages glitching the UI, we can change the logger level before starting: iex(1)> Logger.configure(level: :error). Being a graphical UI, observer, like Live Dashboard, can show charts and other non-text visualisations that the CLI observer version cannot.
There is a lot going on in the observer tools, and we'll only look at a couple of views they provide. The biggest difference feature-wise between observer and Live Dashboard is that observer does not show telemetry data.
CPU and memory
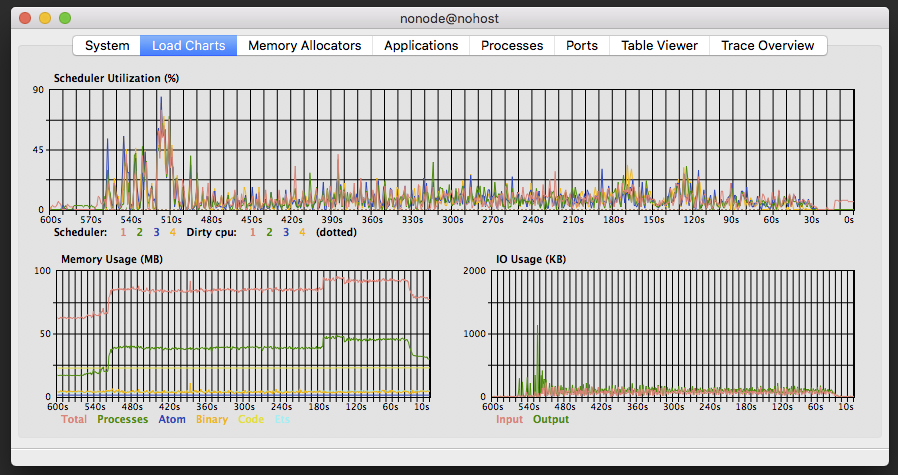
Observer, like Live Dashboard, can break down the memory usage within the BEAM. In the Load Charts view, we can see timeseries charts for scheduler utilization, memory and I/O. Scheduler utilisation, like run queue length, or reductions, is a proxy for CPU load. Scheduler utilization is a bit more intuitive a measure, as it is bounded to 100% and usually relates back to the number of CPU threads on the host machine.
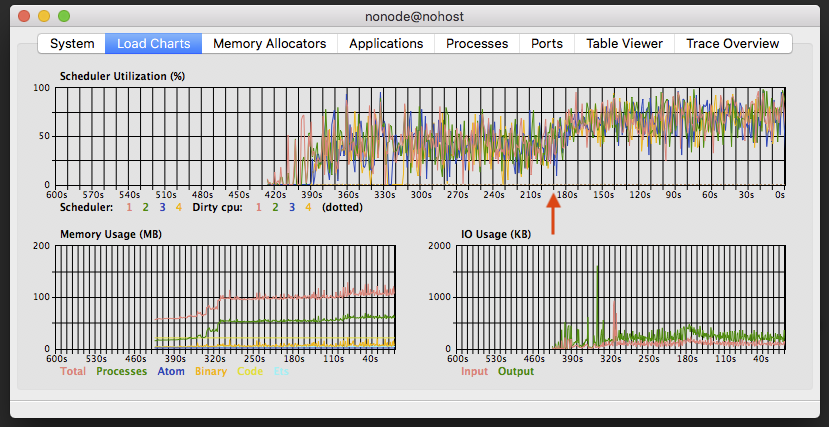
If we inject a fault into our application that causes CPU and/or memory to be excessively consumed, we can see the effects in the Load Charts view. In the below screen capture, we can see the result of a fault injected at around the 200 seconds mark (back in time from current time). CPU load jumps and memory usage starts to ramp up.
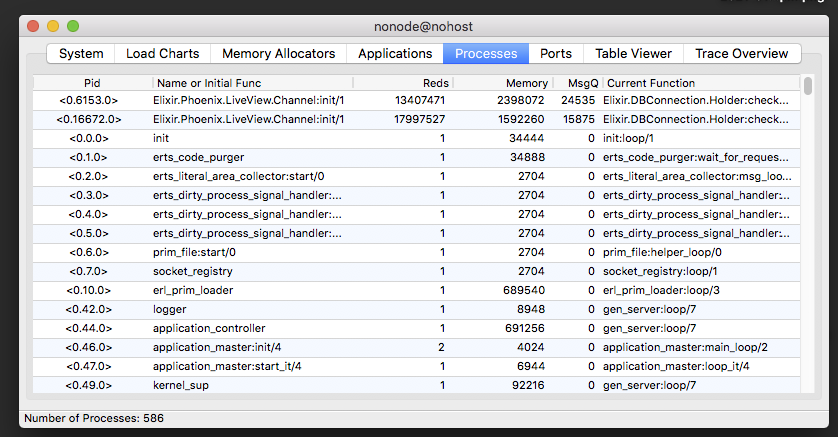
Message Queue
The processes view of observer shows a table of the processes running in the BEAM. It updates periodically, so we can watch the state of the system change. Sorting by message queue size will allow us to see if there are any problematic processes. Along with the message queue size, Reds (reductions) and memory are also dead give-aways that something is not right with these LV processes in the screen shot below.
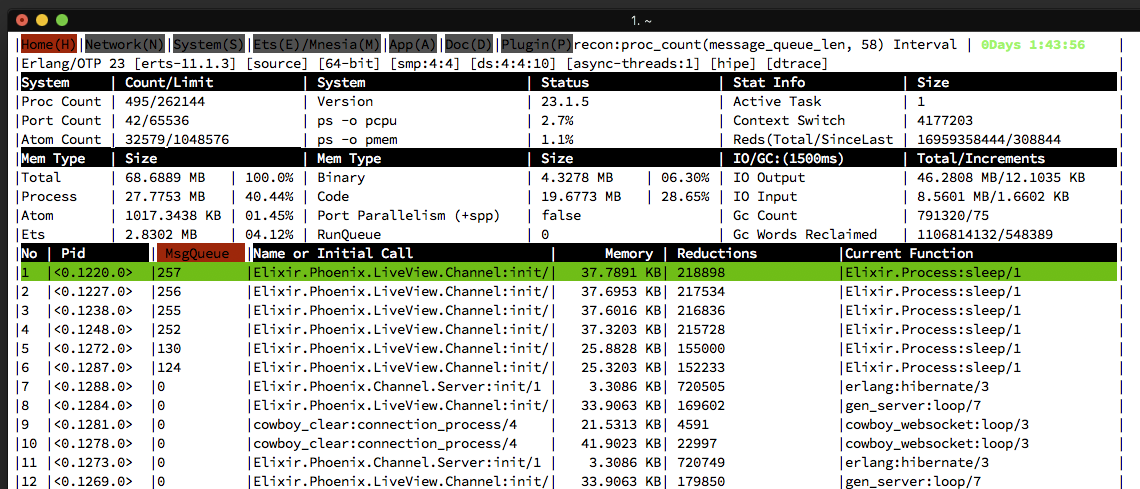
The home view of observer\_cli also has a table of processes, which can be sorted by the various columns.
Observations on observer
The observer tools are lauded in the BEAM community for their usefulness. We've only scratched the surface here, focusing on a few of the myriad features they provide. Performance issues can be observed in real time and we can look at individual processes to give us a head start tracking down root causes.
Final thoughts
The interest in Phoenix LiveView as an option for building dynamic web applications is ever-increasing. And for good reason - LiveView let's us rapidly stand up a web application with refresh-less dynamic updates in pure Elixir. LiveView leverages the characteristics of the BEAM VM to keep our applications snappy and performant. However, through growth in the load on our app, or because of performance targets we may need to meet, we may encounter performance issues. To identify these issues, we need to monitor our application.
In this post, we've seen how we can use some of the native, close-at-hand tools in the BEAM ecosystem to monitor the performance of our LiveView application. Phoenix Live Dashboard is a library, itself built using LiveView, that can be used in our apps to quickly visualise BEAM telemetry metrics and live data. Observer and observer_cli also visualise live data from our running BEAM systems. Together, we can use these tools to look for performance issues, such as higher CPU consumption, memory, and message queue leaks.
Because the tools we've looked at are close at hand, we can stand up a monitoring solution for our applications very quickly. We also don't need to worry about third party tools. This can be great in the early stages of our app development and deployment, before we've decided on which third party tools, if any, we'll use. However, tools that implement more featureful Application Performance Management, may be an option down the track. As always in software development, there are engineering and value tradeoffs to be made.
So, with the topics covered in this post, we have a good foundation for measuring the performance of our LiveView applications. In future posts, we will take this capability, and use it to asses the performance improvements that we can gain through various design changes that can be made to our LiveViews. We also intend to explore specific performance characteristics in more depth, and the capabilities of third-party APM tools compared to what we've seen here.
Thanks for reading, and all the best in your LiveView adventures!
References
https://hexdocs.pm/phoenixlivedashboard/Phoenix.LiveDashboard.html
https://github.com/beam-telemetry/telemetry
https://hexdocs.pm/phoenix/telemetry.html
https://hexdocs.pm/phoenixlivedashboard/Phoenix.LiveDashboard.html#module-installation
https://hexdocs.pm/phoenixlivedashboard/metrics_history.html
https://hexdocs.pm/circular_buffer/CircularBuffer.html
https://erlang.org/doc/apps/observer/observer_ug.html
https://erlang.org/doc/apps/observer/observer.pdf
https://hexdocs.pm/observer_cli/
https://en.wikipedia.org/wiki/Applicationperformancemanagement